9. Analytics and Statistics
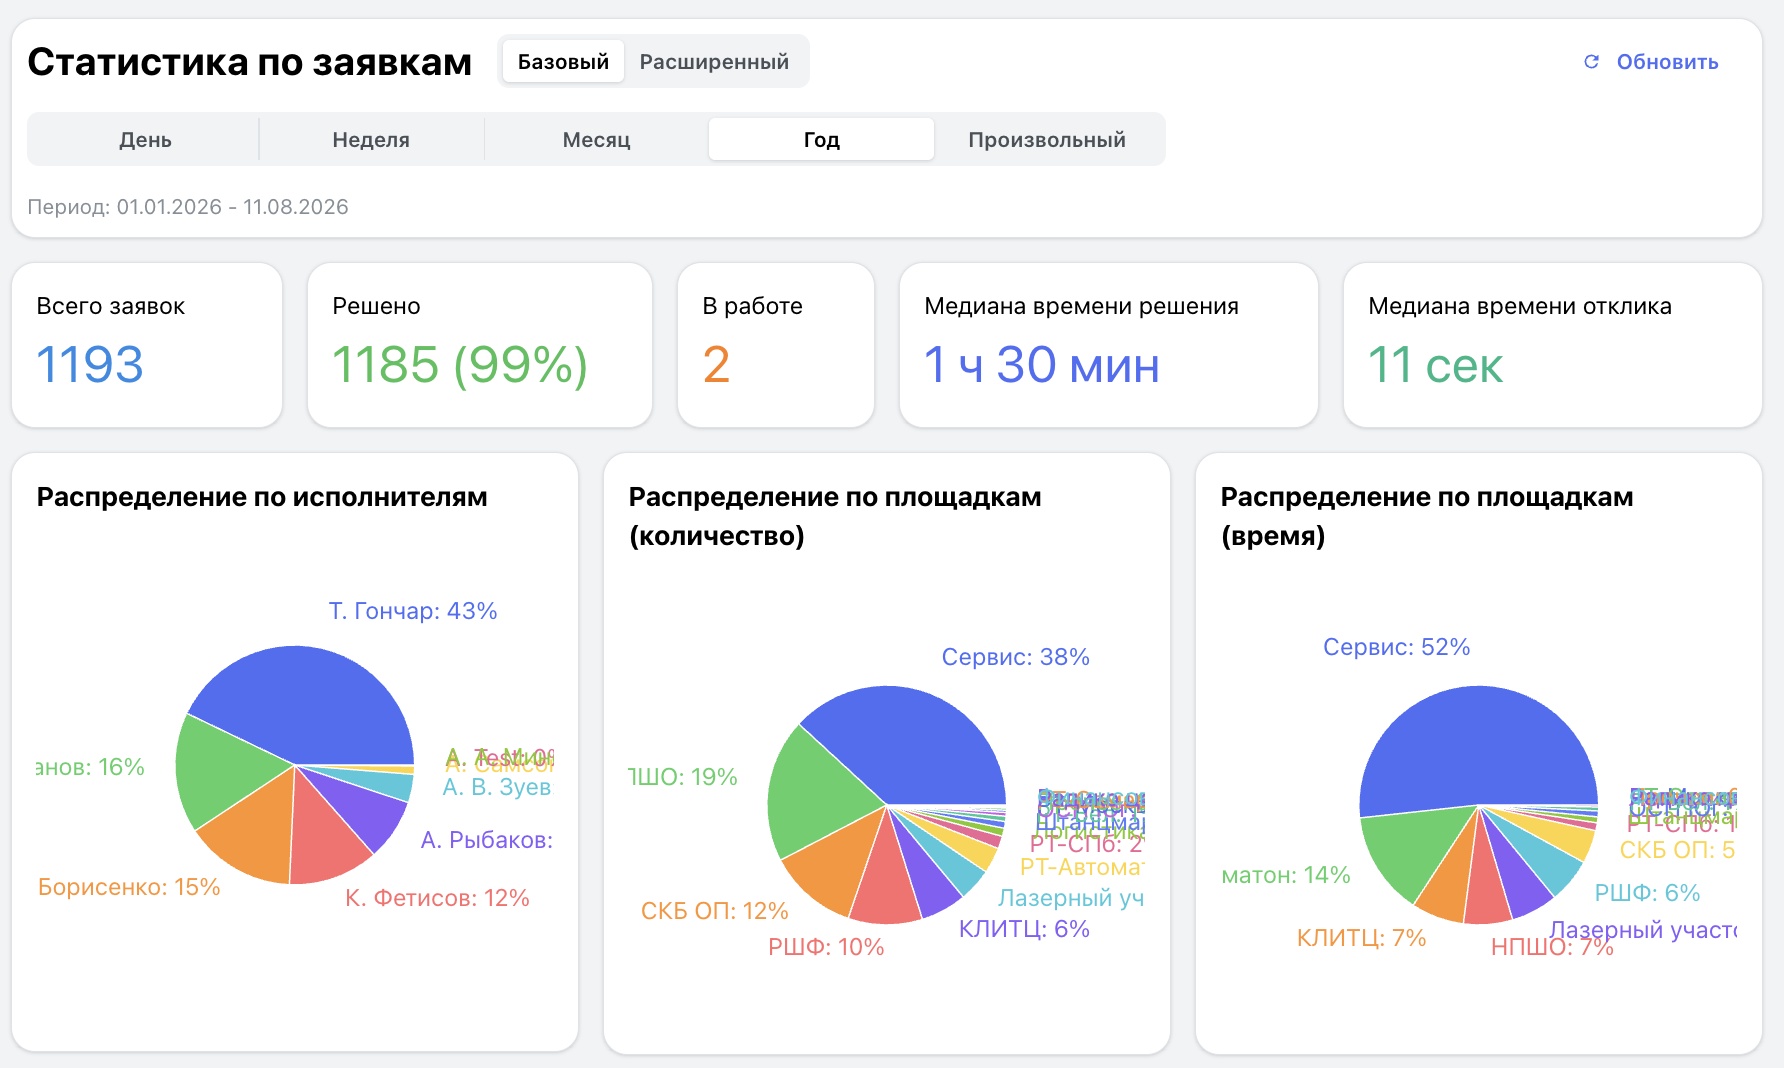
The Service Request Statistics section analyses maintenance-team performance and request-processing efficiency. Two levels of detail are available: Basic and Advanced.
Analysis period
Statistics can be generated for a day, week, month, year, or custom date range.
Key metrics
For the selected period, ServiceBack displays:
- total requests;
- the number and percentage resolved;
- requests currently in progress;
- median resolution time;
- median maintenance-team response time.
Median values reduce the influence of isolated, unusually long requests and provide a more representative picture.
Request distribution and trends
Requests can be analysed by assignee, by site, and by total work time per site. The trend chart helps identify periods of rising fault rates, recurring workload peaks, problematic production areas, and changes following maintenance improvements.
Assignee statistics
For each employee, the system shows total requests, resolved requests, requests in progress and on hold, and the resolution rate. This supports workload and performance comparisons.
Equipment statistics
The equipment view identifies assets that generate the most requests, experience the most downtime, require the most maintenance work, or create the greatest workload for the maintenance team.
Advanced equipment statistics
Advanced mode lets users select one or more equipment items and compare:
- request count;
- mean and median resolution time;
- mean and median MTBF (Mean Time Between Failures).
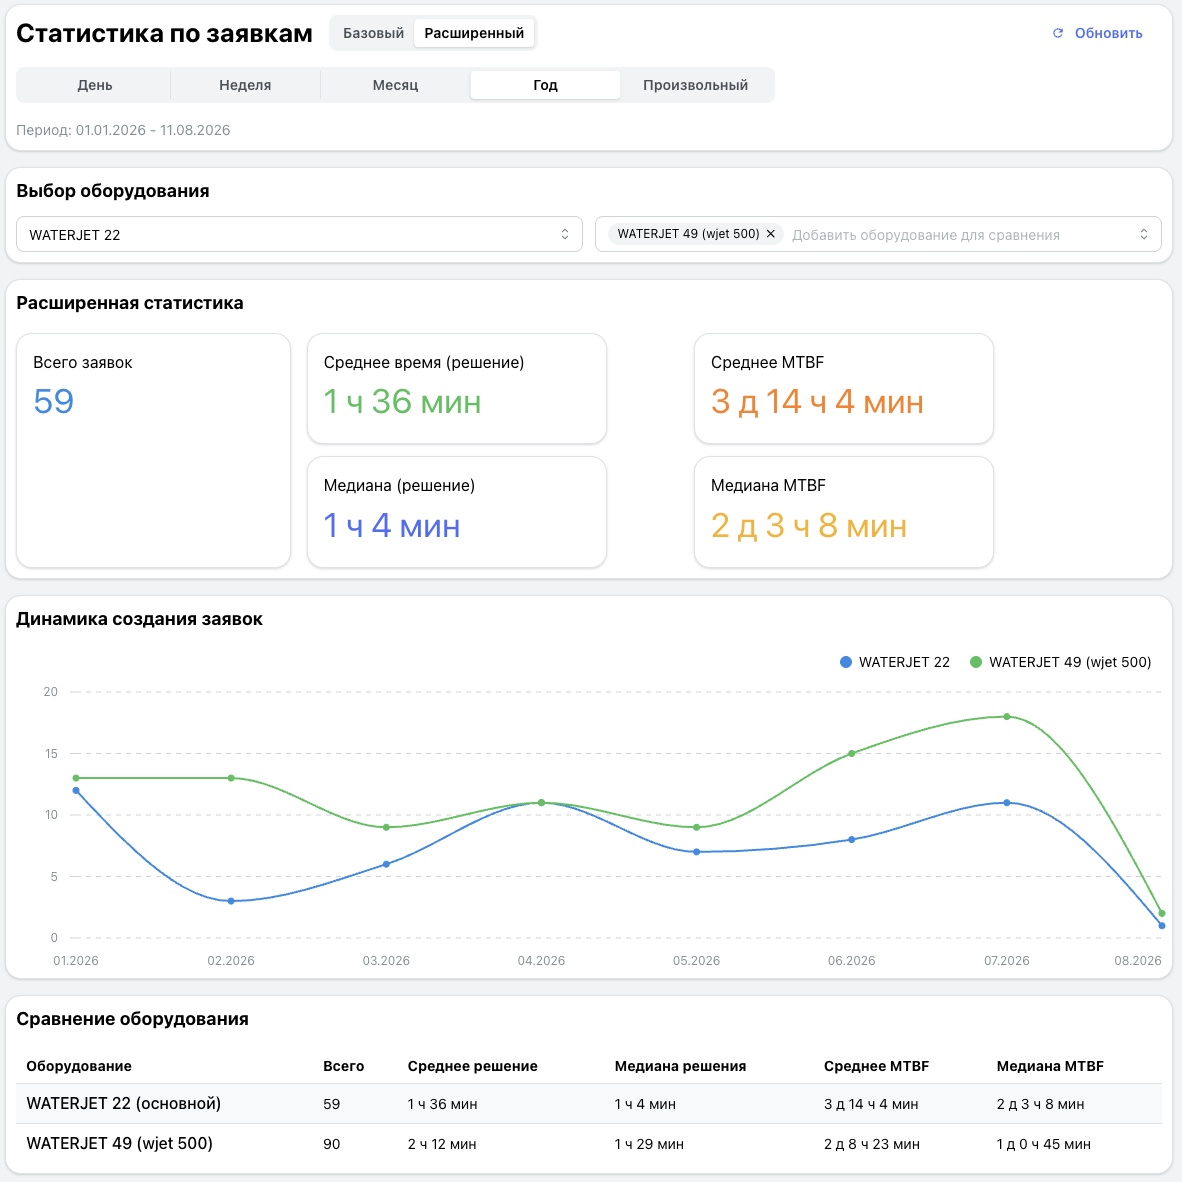
All metrics and charts are recalculated for the selected period. Each asset has its own trend line, while the comparison table brings together fault frequency, resolution speed, and actual reliability.
This analysis helps identify failure-prone equipment, compare manufacturers and models, and make informed decisions about modernization, PPM changes, repair, or replacement.